Variable Planting Density
When managing your crop cycles, grow according to plant recipes or adopting your strategy to the situations at hand, growers change the planting density of their crop. PYLOT now supports recording this moment enabling deeper analyses of your strategies.
Benchmarking
New improvements were made in Benchmarking. Benchmarking for comparing multiple crop cycles from different greenhouses over time. With the new update more information is visible on the line charts. It provides more clarity and enables a quickly overview of your greenhouses and their performance. We also added labor data to the Benchmarking functionality.
Finding the limiting factors for your crops or greenhouses is becoming easier and faster. Thanks to PYLOT you can easily search for these factors influencing your crop and greenhouse performance.
Dashboard Plan Fact Analysis
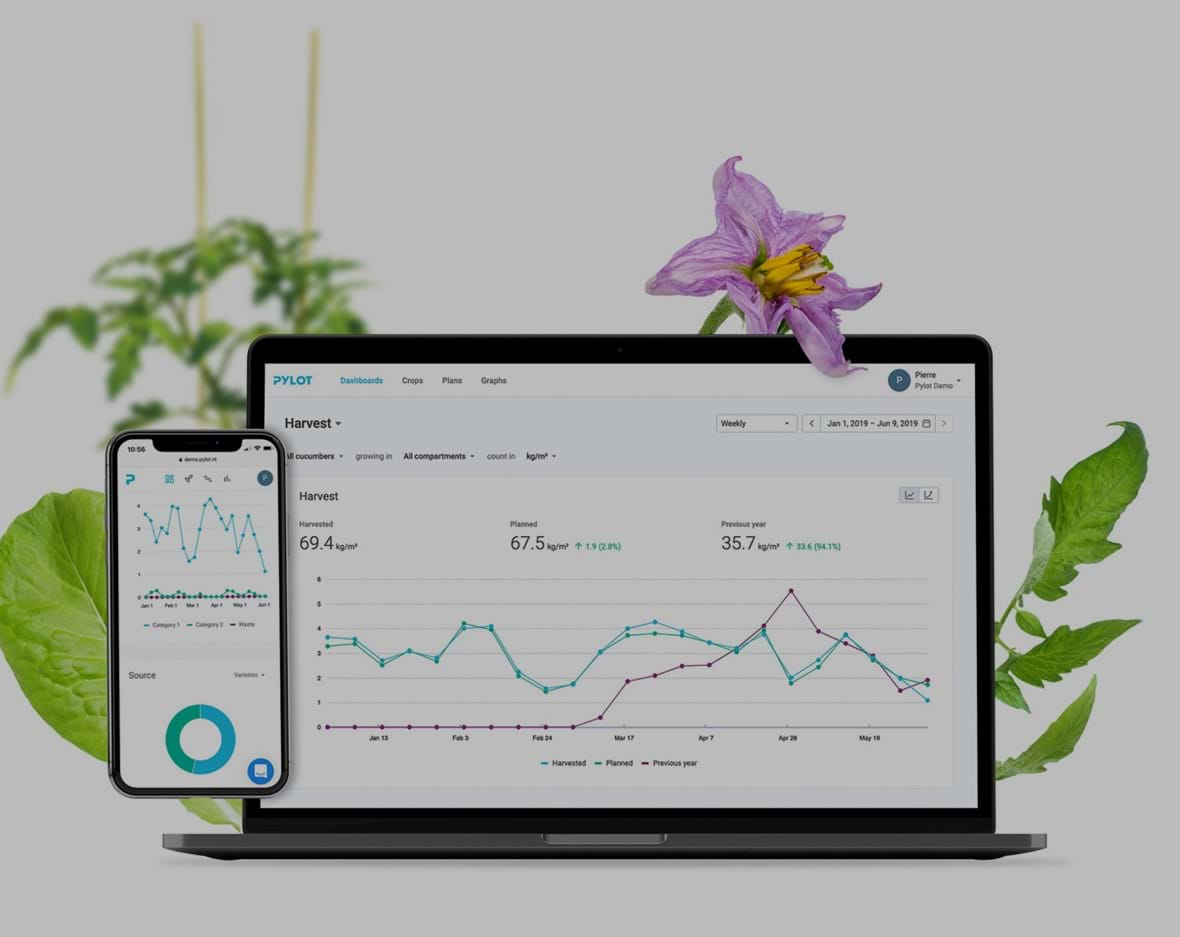
Our most frequent used dashboard “Plan-Fact analysis” was updated. Although relatively new, we received positive feedback to increase its functionality creating more insight and overview. With the new update you can easily select a required timeframe with a new date selector. More detailed information is shared via bar and line charts and we added the possibility to export your data to Excel for further detailed analysis or integration to ERP systems if required.
And there is more, but let's keep our newsletter easy to read. For more updates on our optimizations please read the new item on optimizations.
Data Quality Report
Good analysis can only be done on base of trustworthy data. The Data Quality Report functionality informs you if all required data is entered and made available to you. PYLOT shows the percentage of data completeness, which is visible at any time in PYLOT. You don’t have to go deep into the report to understand whether your data is full or not. Wherever you are in PYLOT, you can always see how much you can rely on your data. Secondly we have added new filters, enabling you to select greenhouses and types of data. No more irrelevant data on screen, only what you need – increasing your efficiency.
Plans Timeline
Managing multiple Crop cycles and Greenhouses generally generates a dashboard with a lot of data. To create more clarity we have added more selection and filter settings in our Plans section. Enabling better overview and clarity when analyzing overall Plan vs Harvest performance.
